How to Build the Internal Business Case for 3D Development: A Guide for CPOs
A CPO's guide to building internal buy-in for 3D apparel development - align finance, production, and design around a phased pilot that gets approved.
For some ROI conversations about 3D development, most starting point is the sampling stage. How many samples did you cut? How much did shipping cost? That framing misses our real targets for business value creation: Design Leaders. Just as much as creative decision-making validated in 3D is backed by physics-based simulation and certified mill data, the return on digital development starts upstream: through the range of ideas tackled, the speed of internal alignment, and the quality of decisions locked in before production even gets underway.
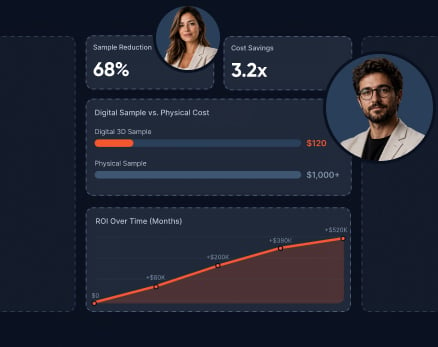
The prevailing approach to measuring 3D investment had been written for operations. It counts the number of sample rounds, calculates freight costs, and assigns a dollar value to the elimination of physical prototypes. That math is real. But it accounts for the story of a Product Leader, not a Design Leader.
Design Leaders juggle a different set of pressures: creative direction across seasonal collections, ambition for exploration against development calendars, and accountability to ensure the design vision and what ultimately ships are aligned. The fee they bear for removing 3D will not be reflected in a sampling invoice. It manifests as narrow concept exploration in early ideation, approval cycles that grind to a halt when stakeholders cannot assess looks without physical samples, and late-stage changes driven by decisions made without upstream validation.
One of the main lessons of industry research is that changes in design made after they become technical development cost four to six times more to resolve than those caught at the conceptual stage. In the larger part, the upstream ROI of 3D comes from just how expensive all of those late changes that never happen are.
This framework gives Design Leaders a tangible way to measure 3D investment when evaluated against the outcomes in which their role makes a difference. Each metric corresponds to a specific point in the design process and a specific type of value generated by physics-based 3D validation.
Consider the number of different design directions tested in every collection before range locks. Physical sampling limits idea generation - when each concept needs a prototype to test it with, groups edit themselves before starting. This constraint is eliminated by three-dimensional development. Compare the concepts assessed per collection between the same season before 3D adoption and the same season after. A 30% to 50% change in direction without a corresponding increase in sample spend indicates a significant expansion of creative capacity.
Calculate the average number of days from design upload to cross-functional sign-off per style. There is usually not much disagreement about delaying approval - it typically stems from a lack of a shared visual reference appropriate for managers and leaders to base decision-making on. Samples arrive physically two to four weeks later. Digital assets based on certified mill data and physics-based simulation are instantly available and perform just like the real fabric. Brands with 3D as the primary alignment tool report an approval cycle compression of three to five weeks across a complete collection. This is calendar reclaimed - time that flows straight into production lead time or more creative development.
Follow the percentage of styles requiring design changes once the technical pack is released and production is activated. Changes made late in the production cycle are not failures of production - they are decisions made without sufficient information. Three-dimensional development, based on simulation accuracy established at the production level, pushes those decisions forward on time. A reduction of 20% to 30% in post-handoff change requests results in cost recovery for development, preserved supplier relationships, and calendar time saved.
Score the actual first production samples against the identified digital file on a set of performance measures: construction, fit, material behavior, and colorway accuracy. Monitor the percentage of styles that gain first-sample sign-offs without a revision at the design level. Stronger first-sample accuracy is a clear signal that upstream validation is going well - and that ROI is not being eliminated at the production handoff.
| Browzwear Capability | Operational Change | Business Outcome |
|---|---|---|
| Physics-based simulation with certified mill data | Design decisions made digitally act as they would in physical production | Improved first-sample accuracy; fewer design changes after technical handoff |
| Photorealistic digital asset development at the concept phase | Stakeholders review and approve appearances in the absence of physical samples | Approval cycles shortened by three to five weeks per collection |
| Rapid colorway and silhouette iteration in the 3D environment | More design directions explored per cycle, with no proportional increase in sample spend | Creative exploration breadth increases 30% to 50% at no additional cost |
| Production-validated digital twin output | Design intent is locked before production engagement, not discovered through physical iteration | Late-stage change rate reduced; development cost per style decreases |
Design and validation in a conventional brand workflow are linear. A concept is generated, a sample is ordered, the sample arrives, stakeholders check it, and changes are issued. Each round adds two to four weeks and a fixed cost per sample.
When Browzwear is in place, validation becomes part of the design process. Designers build and iterate in a three-dimensional environment from the very initial idea phase. Material properties are determined from certified mill data, so the simulation mimics how the actual fabric drapes, stretches, and moves. By the time a design advances into the internal review stage, it has already been validated - not as a render approximation, but as a production-ready digital twin.
Sign-off is performed weeks earlier on the development calendar. The first physical sample, when produced, arrives closer to the approved design because the digital file it was built from was accurate from the start. The return is not just in samples eliminated - it is in calendar time regained, creative directions explored without cost penalty, and design quality upheld from initial concept through production.
Not all 3D tools give the same downstream result. Some optimize for speed of visualization - producing visually convincing renders quickly without firmly tying simulation to realistic material behavior. For internal mood boards, that may be enough. For a Design Leader who requires decisions made in 3D to survive production, it is not.
A tool that approximates fabric behavior will create alignment in the review room that does not hold up during the handoff to production. The design is approved, the sample arrives, and the drape is different. The result is a late-stage change request - and the ROI equation comes unstuck. Enterprise-grade accuracy requires that the digital twin behave like the actual garment at every stage: during design review, with the supplier, and on the manufacturing floor.
The typical concern that Design Leaders raise in 3D investment discussions is this: ROI is measured at the sampling stage and serves as an indicator for the CFO. Creative value is difficult to quantify and harder to justify in a business case.
That framing is understandable but inaccurate. Every metric in this framework can be tracked with data that already exists in most brand workflows: approval timestamps, change request logs, first-sample sign-off rates, and seasonal concept counts. The gap is not in the data - it is in whether those metrics are being captured and reported as ROI indicators.
The business case is even stronger when Design Leaders come to the table with both sets of numbers: the sampling cost reduction that operations already measures, and the upstream creative ROI that design is uniquely positioned to track. The practical starting point is one season: establish a baseline across all four metrics, run a pilot collection using 3D as the primary validation tool, and measure the delta.
The most prominent apparel brands are redefining how creative ROI is measured - and building the business case for 3D development at every stage of design. See exactly how in a live walkthrough tailored around your workflow.
