Back to Blog
Blog

The real capacity math for 3d sampling

Subscribe

The capacity math: How manufacturers calculate real throughput gains from digital sampling


Most manufacturers know that digital sampling should unlock capacity. What they do not know - and almost nobody quantifies - is exactly how much. You have heard the claim: eliminate two rounds of physical samples per style, and you suddenly fit 30 percent more styles into a season. But you have never modeled it against your own cost structure, your own lead times, your own floor constraints.

Why Capacity Is Invisible in Your Operation

Capacity in manufacturing is not a fixed number. It lives in the gap between what you are doing and what you can do if sampling does not take six weeks per style. Physical sampling is so ingrained in your workflow that you cannot tell "designing" from "proving the design works." A technical director designs a style in two weeks. The factory floor cuts and sews a sample in one week. The garment travels for review in one week. Feedback is returned. Another sample is cut and sewed. By the time a style is approved, six weeks have passed - and your technical director could have designed three more styles in that time frame. But almost no manufacturer measures this loss of capacity in their business case. They see the 400 dollars per sample cost. They never calculate the 1,000 to 2,000 dollars in margin sitting in the elapsed time.

Manufacturers can calculate real capacity gains by modeling production-ready styles

Manufacturers can calculate real capacity gains by modeling exactly how many production-ready styles each eliminated sampling round unlocks per season.

Here is the math. Assume you run 40 styles per season. Each style goes through two rounds of sampling - approval and revision. Each round takes three weeks. That is six weeks for each style in the sampling cycle alone. In those six weeks, your technical director could have designed two additional styles.

At 500 dollars margin per style, that is 1,000 dollars in margin loss per style to the sampling loop. Across 40 styles, that is 40,000 dollars in capacity left on the table because your workflow is stuck in physical iterations.

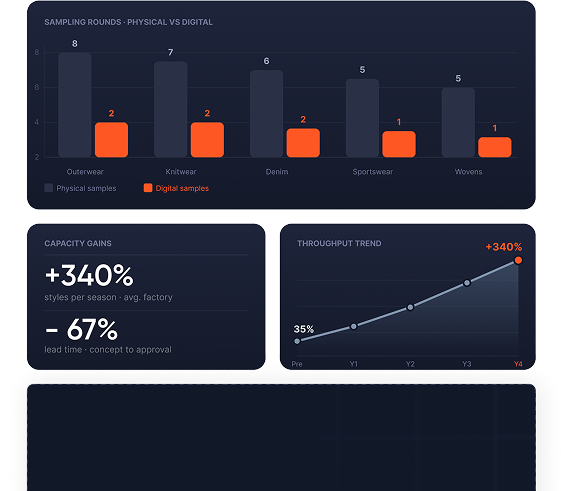
Now compress that cycle to two weeks with digital sampling. Digital validation happens, clients review in 3D, revisions happen in the file and you cut once. That six week cycle becomes two weeks. You have freed up four weeks of capacity per style. In a 40-style season, that is 160 weeks of designer time freed up, enough to add eight to ten more styles to your capacity. At 500 dollars margin per style, that is 4,000 to 5,000 dollars in recovered margin per season. Subtract 400 dollars in software cost and you are ahead by a significant margin.

Implication: Capacity Is only present when you measure it

This is where digital sampling breaks down for most manufacturers. Vendors show you a faster workflow. They do not show you how to calculate whether that workflow actually expands your capacity in your operation, against your specific costs and client mix.

The barrier is not technology. It is visibility. You cannot see capacity gains in a demo. You can only see them in your own data - your sampling cost per style, your elapsed time per round, your designer bandwidth per season. Take those three numbers and the math is clear. Skip that measurement and the investment feels speculative.

How Browzwear translates to real capacity recovery

Browzwear Capability Operational Change Business Outcome
Production-validated 3D files received with technical pack Technical director validates fit in simulation, eliminating wait for physical sample shipment 60 percent reduction in elapsed time per round
Integrated technical pack eliminates file interpretation Floor team cuts revision samples once per style instead of multiple times Two to three fewer physical iterations per style
Digital review replaces synchronous sample meetings Brand clients approve or flag issues in 3D environment instead of waiting for physical sample travel One to two weeks recovered per season per client

The operational shift from physical to digital validation

In your current process: brand sends technical pack, your team cuts sample, garment travels for review, feedback comes back, you cut revision samples. This cycle repeats two to three times before approval. That is six to nine weeks of elapsed time.

With Browzwear: brand sends a production-ready 3D file with the technical pack. A technical director validates fit in the platform. The brand client reviews it in the 3D environment asynchronously. Revisions happen in the file first, then cut once and reviewed once. The cycle shrinks to two to three weeks. You have freed four to six weeks per style - weeks your technical director is now using to design additional styles instead of managing sampling logistics.
Why headcount and capital are not the answer

Hiring more technical staff to add capacity takes months and costs 80,000 to 120,000 dollars per designer. Adding floor space requires capital investment in equipment and facilities. Digital sampling unlocks capacity without headcount or capital - it reallocates existing designer and floor time away from sampling management toward revenue-generating design work. That is a structural advantage no alternative can match.

Addressing the primary adoption concern

How do I know capacity gains will be real and not dependent on my clients adopting digital workflows?

You do not need universal client adoption to realize gains. Segment your client base. Perhaps 60 percent of your clients have committed to digital workflows. Model the capacity recovery from that segment alone - you will see real ROI. The other 40 percent remain in the physical sampling process and do not slow you down. As more clients adopt digital files, capacity gains compound. But you do not need to wait for complete adoption to see measurable results.

Your essential questions answered

Q: What Is the Real Cost of My Current Sampling Process?
A: Divide your total annual sampling spend (labor, materials, shipping) by your annual style count. Most manufacturers find they are spending 300 to 600 dollars per style in sampling costs alone - and that does not account for the margin lost to elapsed time.
Q: How Do I Calculate Capacity Recovery From Digital Sampling?
A: Count your current sampling rounds per style and your elapsed time per round. Model what happens if digital sampling cuts elapsed time per round from three weeks to one week. How many additional styles could your technical director design in that freed time? Multiply that by your gross margin. That is your potential capacity recovery.
Q: Do All My Clients Need to Adopt Digital Workflows for Me to See ROI?
A: No. Segment your client base by digital readiness. Model capacity gains for the digital-ready segment separately. That subset alone will show ROI. But it does not actually take universal adoption to have measurable results.
Q: How Long Does It Take to Become Fluent With Digital Sampling in My Workflow?
A: Your technical director needs one season - four months - to become fluent using 3D assets as the primary validation tool. The learning curve is steep initially but flattens quickly. Floor team adoption happens through on-the-job training and typically does not require formal training.

Key takeaways

Five critical principles for capacity growth

  • Manufacturers can calculate real capacity gains when they model how many production-ready styles each eliminated sampling round unlocked per season.
  • Capacity cost is hidden in elapsed time, not just material cost. A six week sampling cycle is worth 1,000 to 2,000 dollars in margin loss.
  • Digital sampling does not require universal client adoption to show ROI. Segment your client base by digital readiness and measure gains per segment.
  • Real capacity growth takes place when technical teams stop managing sampling complexity and start designing a variety of styles.
  • The math is unique to your operation. Margin-driven manufacturers who measure their own cost structure will see the ROI.

Move from speculation to certainty

Capacity mathematics is not speculative. Manufacturers who quantify their current sampling costs and capacity constraints see exactly where digital workflows unlock real growth. See how to build that model and move from "will digital help?" to "how much capacity can we unlock?"

Subscribe

Speed up your product development

with virtual prototyping.